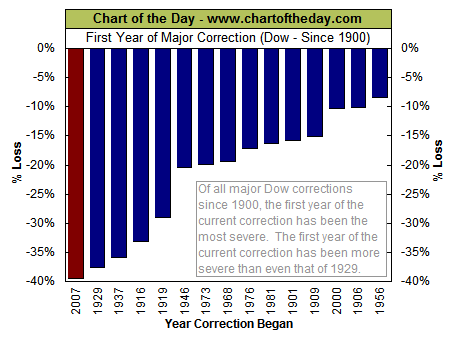
As reported by Chart of the Day, continued concerns regarding the credit crisis, a slowdown in consumer spending, and a further weakening of the US economy sent the Dow down more than 7% on the day. This is on top of the massive value vomiting experienced the previous week.
Today also marks the one-year anniversary of the current "correction". The Dow put in its record high of 14,164.53 back on October 9, 2007. Yesterday, the Dow closed at 8,579.19 -- down 39.4% from its one year old peak. For some perspective on the magnitude of the current decline, this chart illustrates how the Dow performed during the first year of all major corrections since 1900. As the chart illustrates, the first year of the current correction has been more severe than the first year of any correction since 1900 -- and that includes the correction that began in 1929.
Is this a Recession or a Depression?
It's a recession when your neighbor loses his job. It's a depression when you lose your own.Harry S. Truman
Thank you, Mr. Greenspan, you have earned a place in history.


 Entrepreneur, former Fortune 500 senior executive, semi-retired at the age of 39 after founding and growing several businesses in High Technology, Management Consulting and Manufacturing.
No comments:
Post a Comment